

Custom dashboards for the questions your team needs answered.
When the weekly report starts with exporting files and reconciling different numbers, the problem often sits underneath the chart. Zyndix builds dashboards and the data connections behind them, around the metrics your team needs to use.
Start with the decision
Which part of the business needs attention? Which leads became customers? Which work is waiting for approval? A useful dashboard begins with a specific question, an agreed definition of the numbers, and data that can support the answer.
We help define those requirements before selecting the charts. If your existing reporting tool can meet them, we can focus on the data connections and configuration instead of building another application.
What the solution can include.
Data connections
Collect records from agreed APIs, databases or files.
Metric definitions
Document what a number includes, excludes and measures.
Data preparation
Handle identifiers, duplicates, dates and other inconsistencies before reporting.
Dashboards
Create views for the people making the decisions, with relevant filters and access controls.
Refresh and checks
Define how often data updates and how incomplete or failed updates are shown.
Handover
Document the sources, calculations and responsibilities for maintaining the report.
Marketing reporting automation
Marketing reports can involve campaign platforms, web analytics, lead records and payments. We work out how those sources can be connected and where they cannot be matched reliably. Platform-reported conversions and confirmed sales should remain distinguishable, with the attribution assumptions visible.
The first version can focus on one report your team already uses. Additional sources and views can follow when the definitions and data are dependable.
Related work: PulseConf
We built PulseConf as a marketing data warehouse and dashboard, connecting submissions, web analytics and advertising data. The project demonstrates both sides of reporting: preparing the records underneath and presenting a view the team can use.
See the PulseConf case study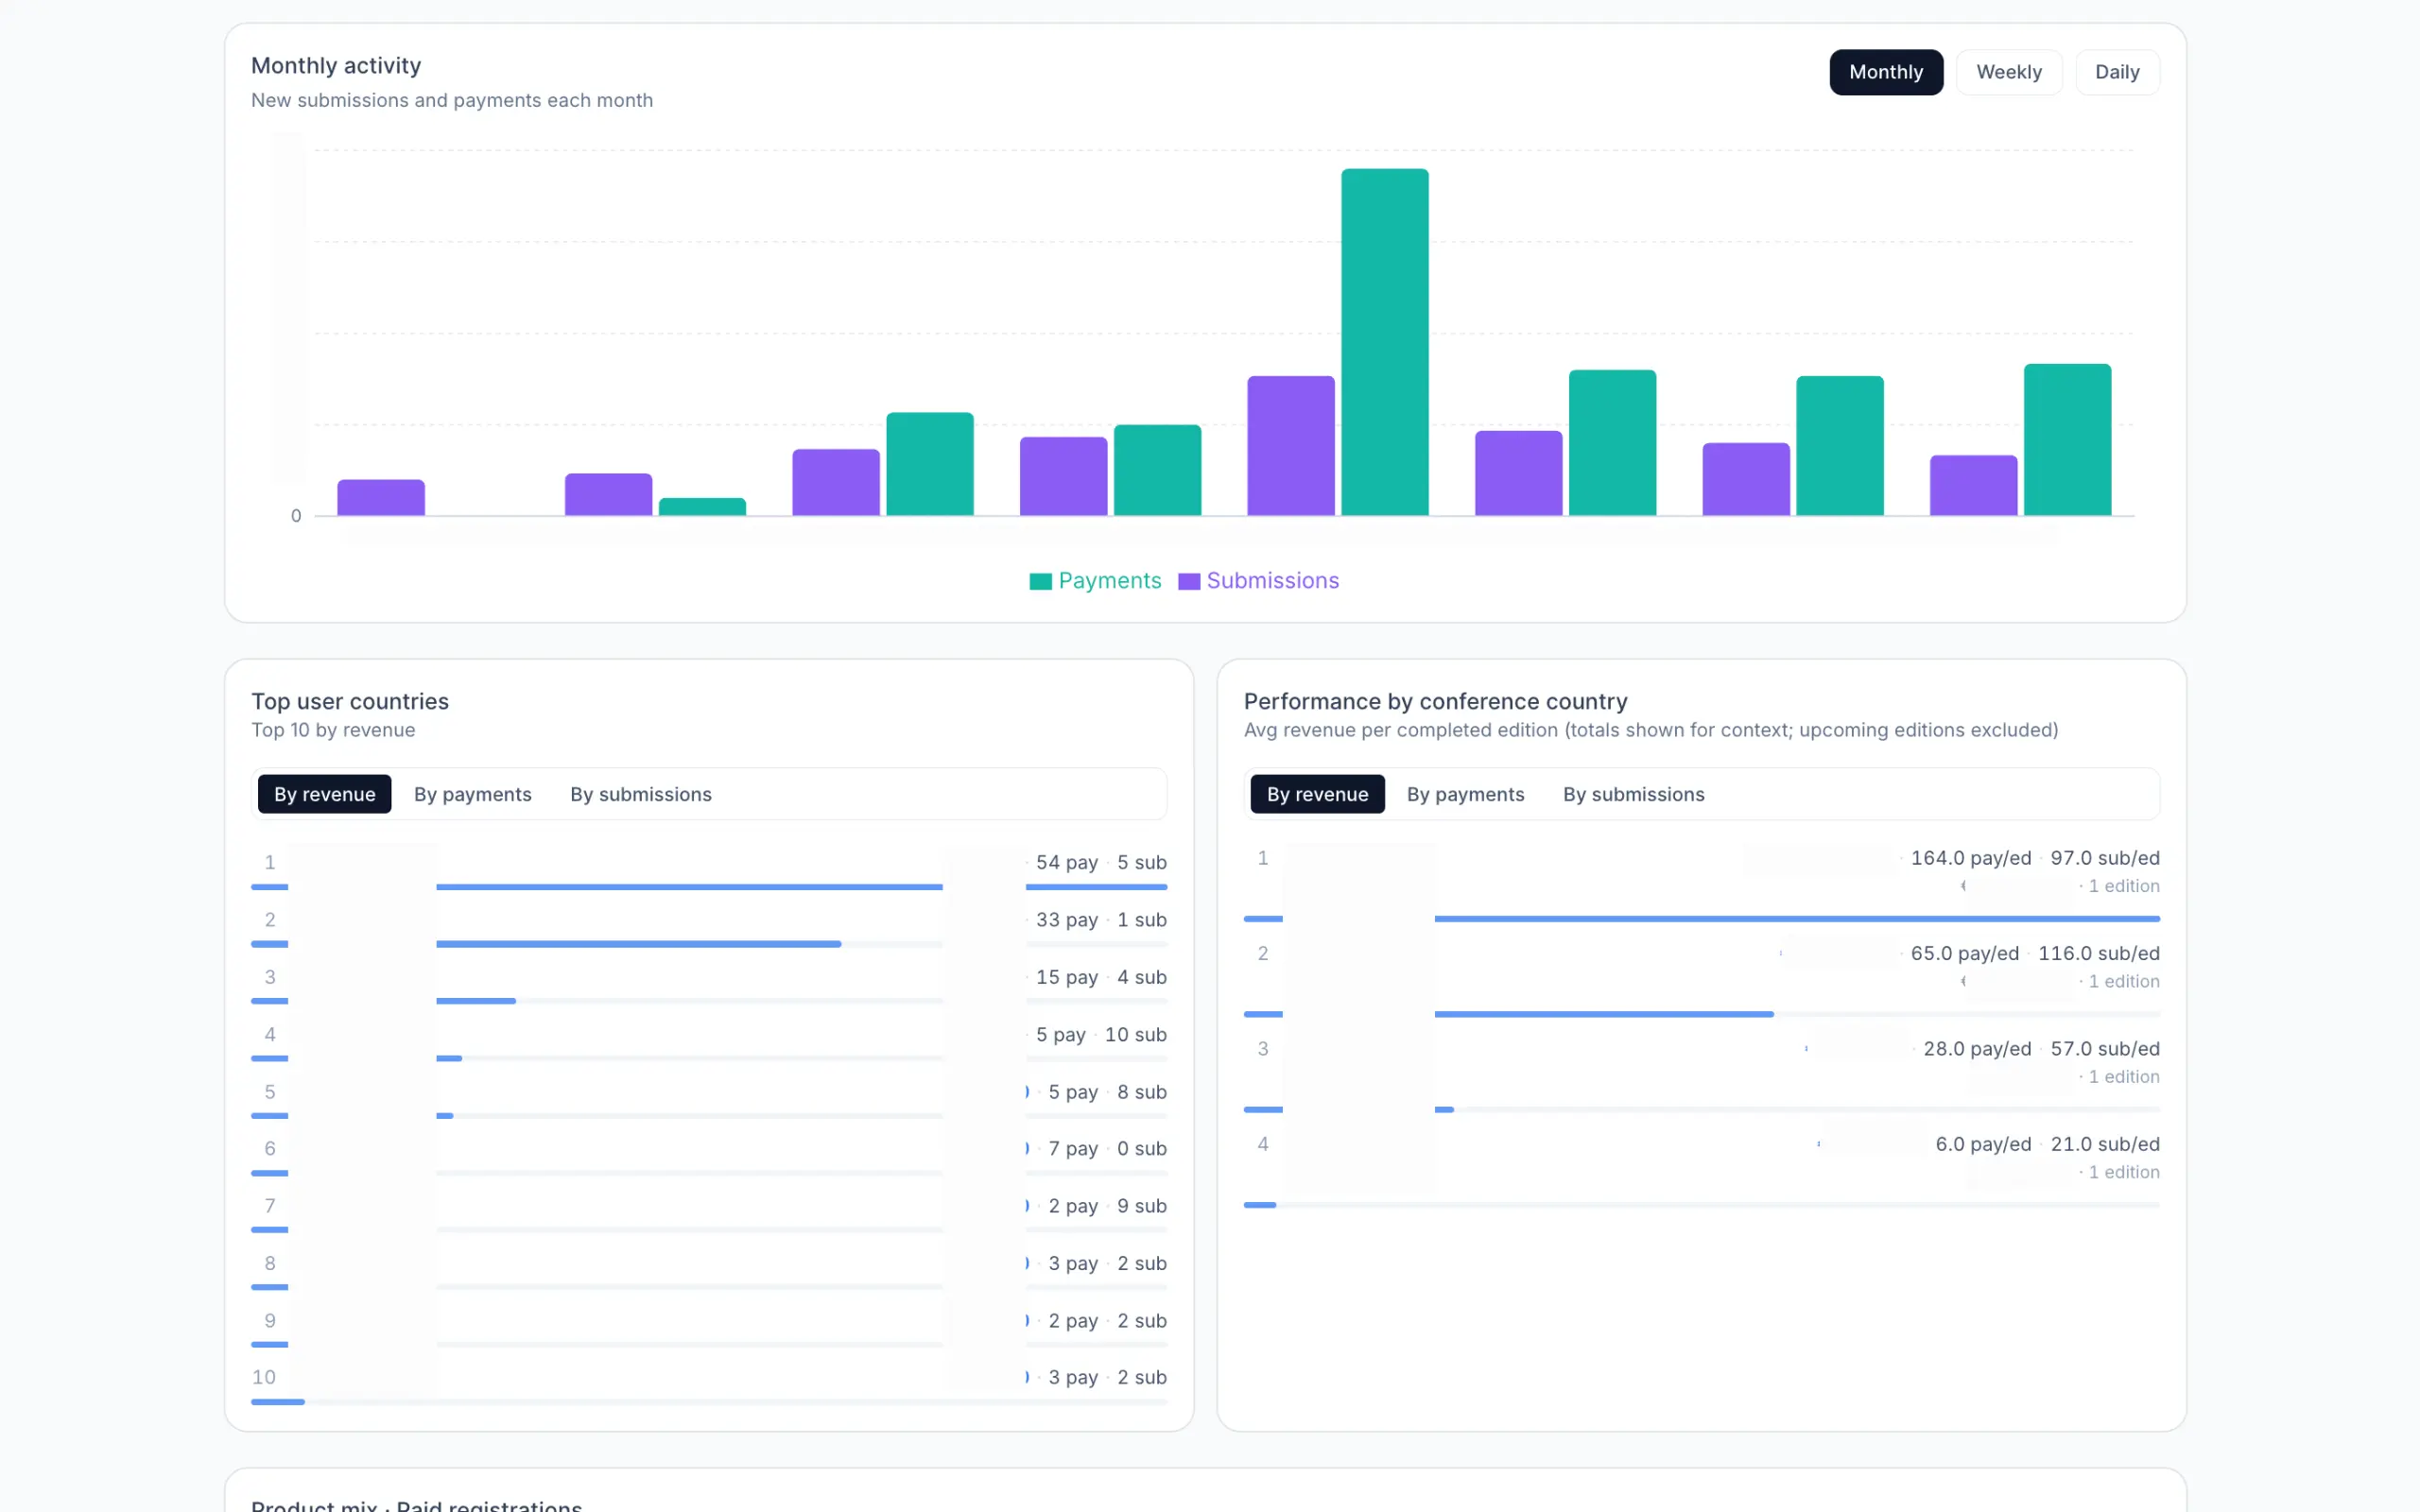
How we scope a dashboard
Choose the decisions and users the first version must support.
Inspect source access, data quality and update frequency.
Agree the metrics and review a sample report.
Build the connections and dashboard, then check the output against source records.
Questions
Workflow automation services
Connect the sources and checks that sit underneath a report, when the work is moving data rather than presenting it.
Custom software development
When the dashboard is part of a wider application — permissions, workflows, or a product around the numbers.
PulseConf
The marketing warehouse and dashboard this page is modelled on — sources connected, unmatched records kept visible.
Bring the report you currently prepare by hand
Show us the files, tools and questions involved. We’ll discuss what can be connected and what a useful first dashboard should contain.