

Marketing data connected to a shared reporting view.
PulseConf brings submission, web-analytics and advertising records into a data warehouse and dashboard. We built the connections and reporting interface to make those sources easier to compare and investigate.
3 sourcessubmissions, web analytics and ads in one warehouse.
100+GA4 properties connected, one per site.
Dailyautomated refresh at 01:00 UTC.
Data everywhere, agreeing nowhere.
A network of academic conferences across three organizer brands generated data in several places — registration sheets, Google Analytics on every site, Google Ads across many campaigns. None of it talked. Answering one simple question — which markets actually pay, not just click? — meant hours of manual cross-referencing, and the numbers from each tool rarely agreed.
- ✕Data in spreadsheets, GA4, and Ads — never joined
- ✕Submissions and payments matched by hand
- ✕"Which country really converts?" took hours
- ✕Numbers that disagreed across tools
- ✓One warehouse, every connected source in shared tables
- ✓Automatic matching of payments to submissions, with unmatched rows left visible
- ✓"Which country really converts?" investigated in the dashboard
- ✓One reporting view, refreshed on a daily schedule
A warehouse underneath, a dashboard on top.
Our founder built this in-house at a Lithuanian conference organiser — not as a Zyndix client delivery. Two pieces work together: a data warehouse that pulls the agreed sources into one Postgres database, cleans them, and keeps them fresh on a schedule — and PulseConf, the dashboard on top that lets the team see those numbers without writing a line of code. That is the same shape of work described on our custom dashboard development page.
Three sources — unified, cleaned, matched, and refreshed every night.
Google Sheets
Submissions + payments
Abstract submissions and payment records, brought into shared tables.
30,000+conference submissions processed.
15,000+payment records reconciled.
Google Analytics 4
Website sessions, one property per site
Session data from the conference sites, kept as its own source.
100+GA4 properties, one per site.
500,000+website sessions across the portfolio.
Google Ads
Campaigns, keywords, search terms
Campaign and search-term records, including the conversions the platform reports.
It cleans messy fields (country, product, and organizer names), then tries to match each paid presenter back to their abstract with fuzzy title matching plus email — currently over 90% of payment records match. A match is a joined record, not proof that an ad caused the payment. Platform-reported conversions (what Google Ads or GA4 attribute to a campaign) stay in their own buckets. Matched payments are warehouse joins between submission and payment rows. Unmatched records stay visible instead of being forced into a conversion. The pipeline refreshes daily at 01:00 UTC and archives raw extracts to S3 object storage.
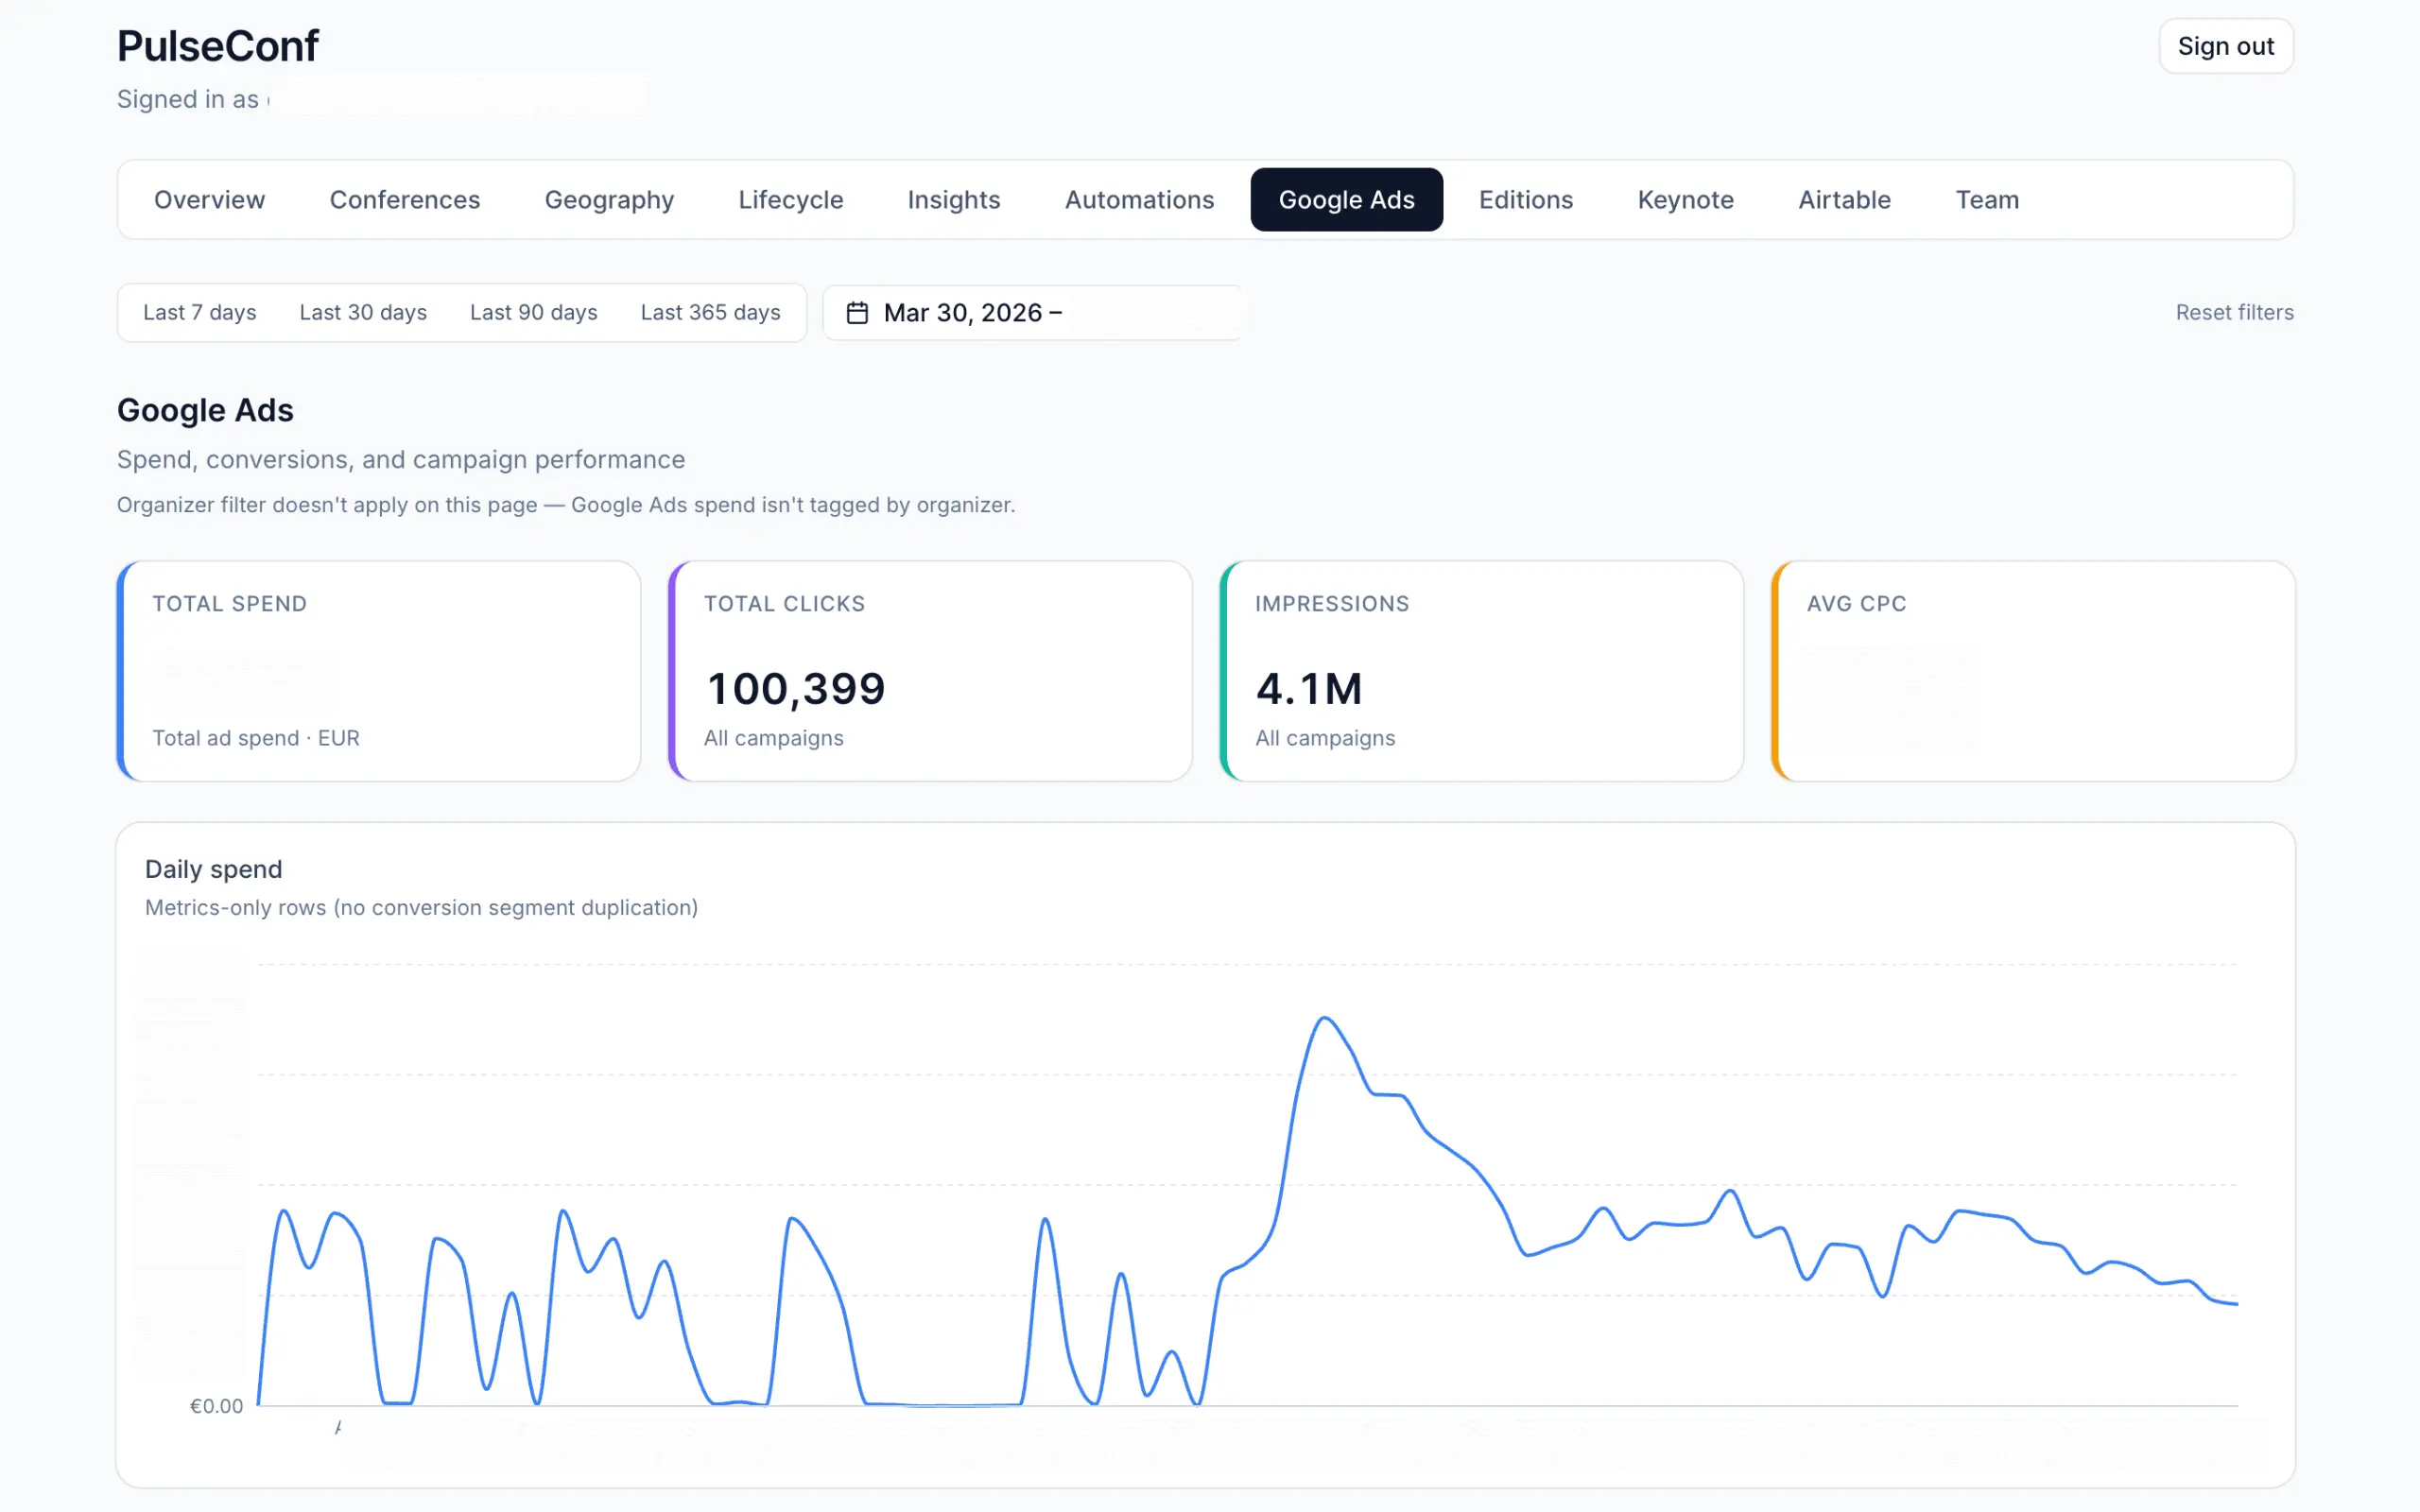
Ad performance with conversions kept in three separate buckets — platform-reported, matched payments, and unmatched records — never blended into one certainty figure.
Overview
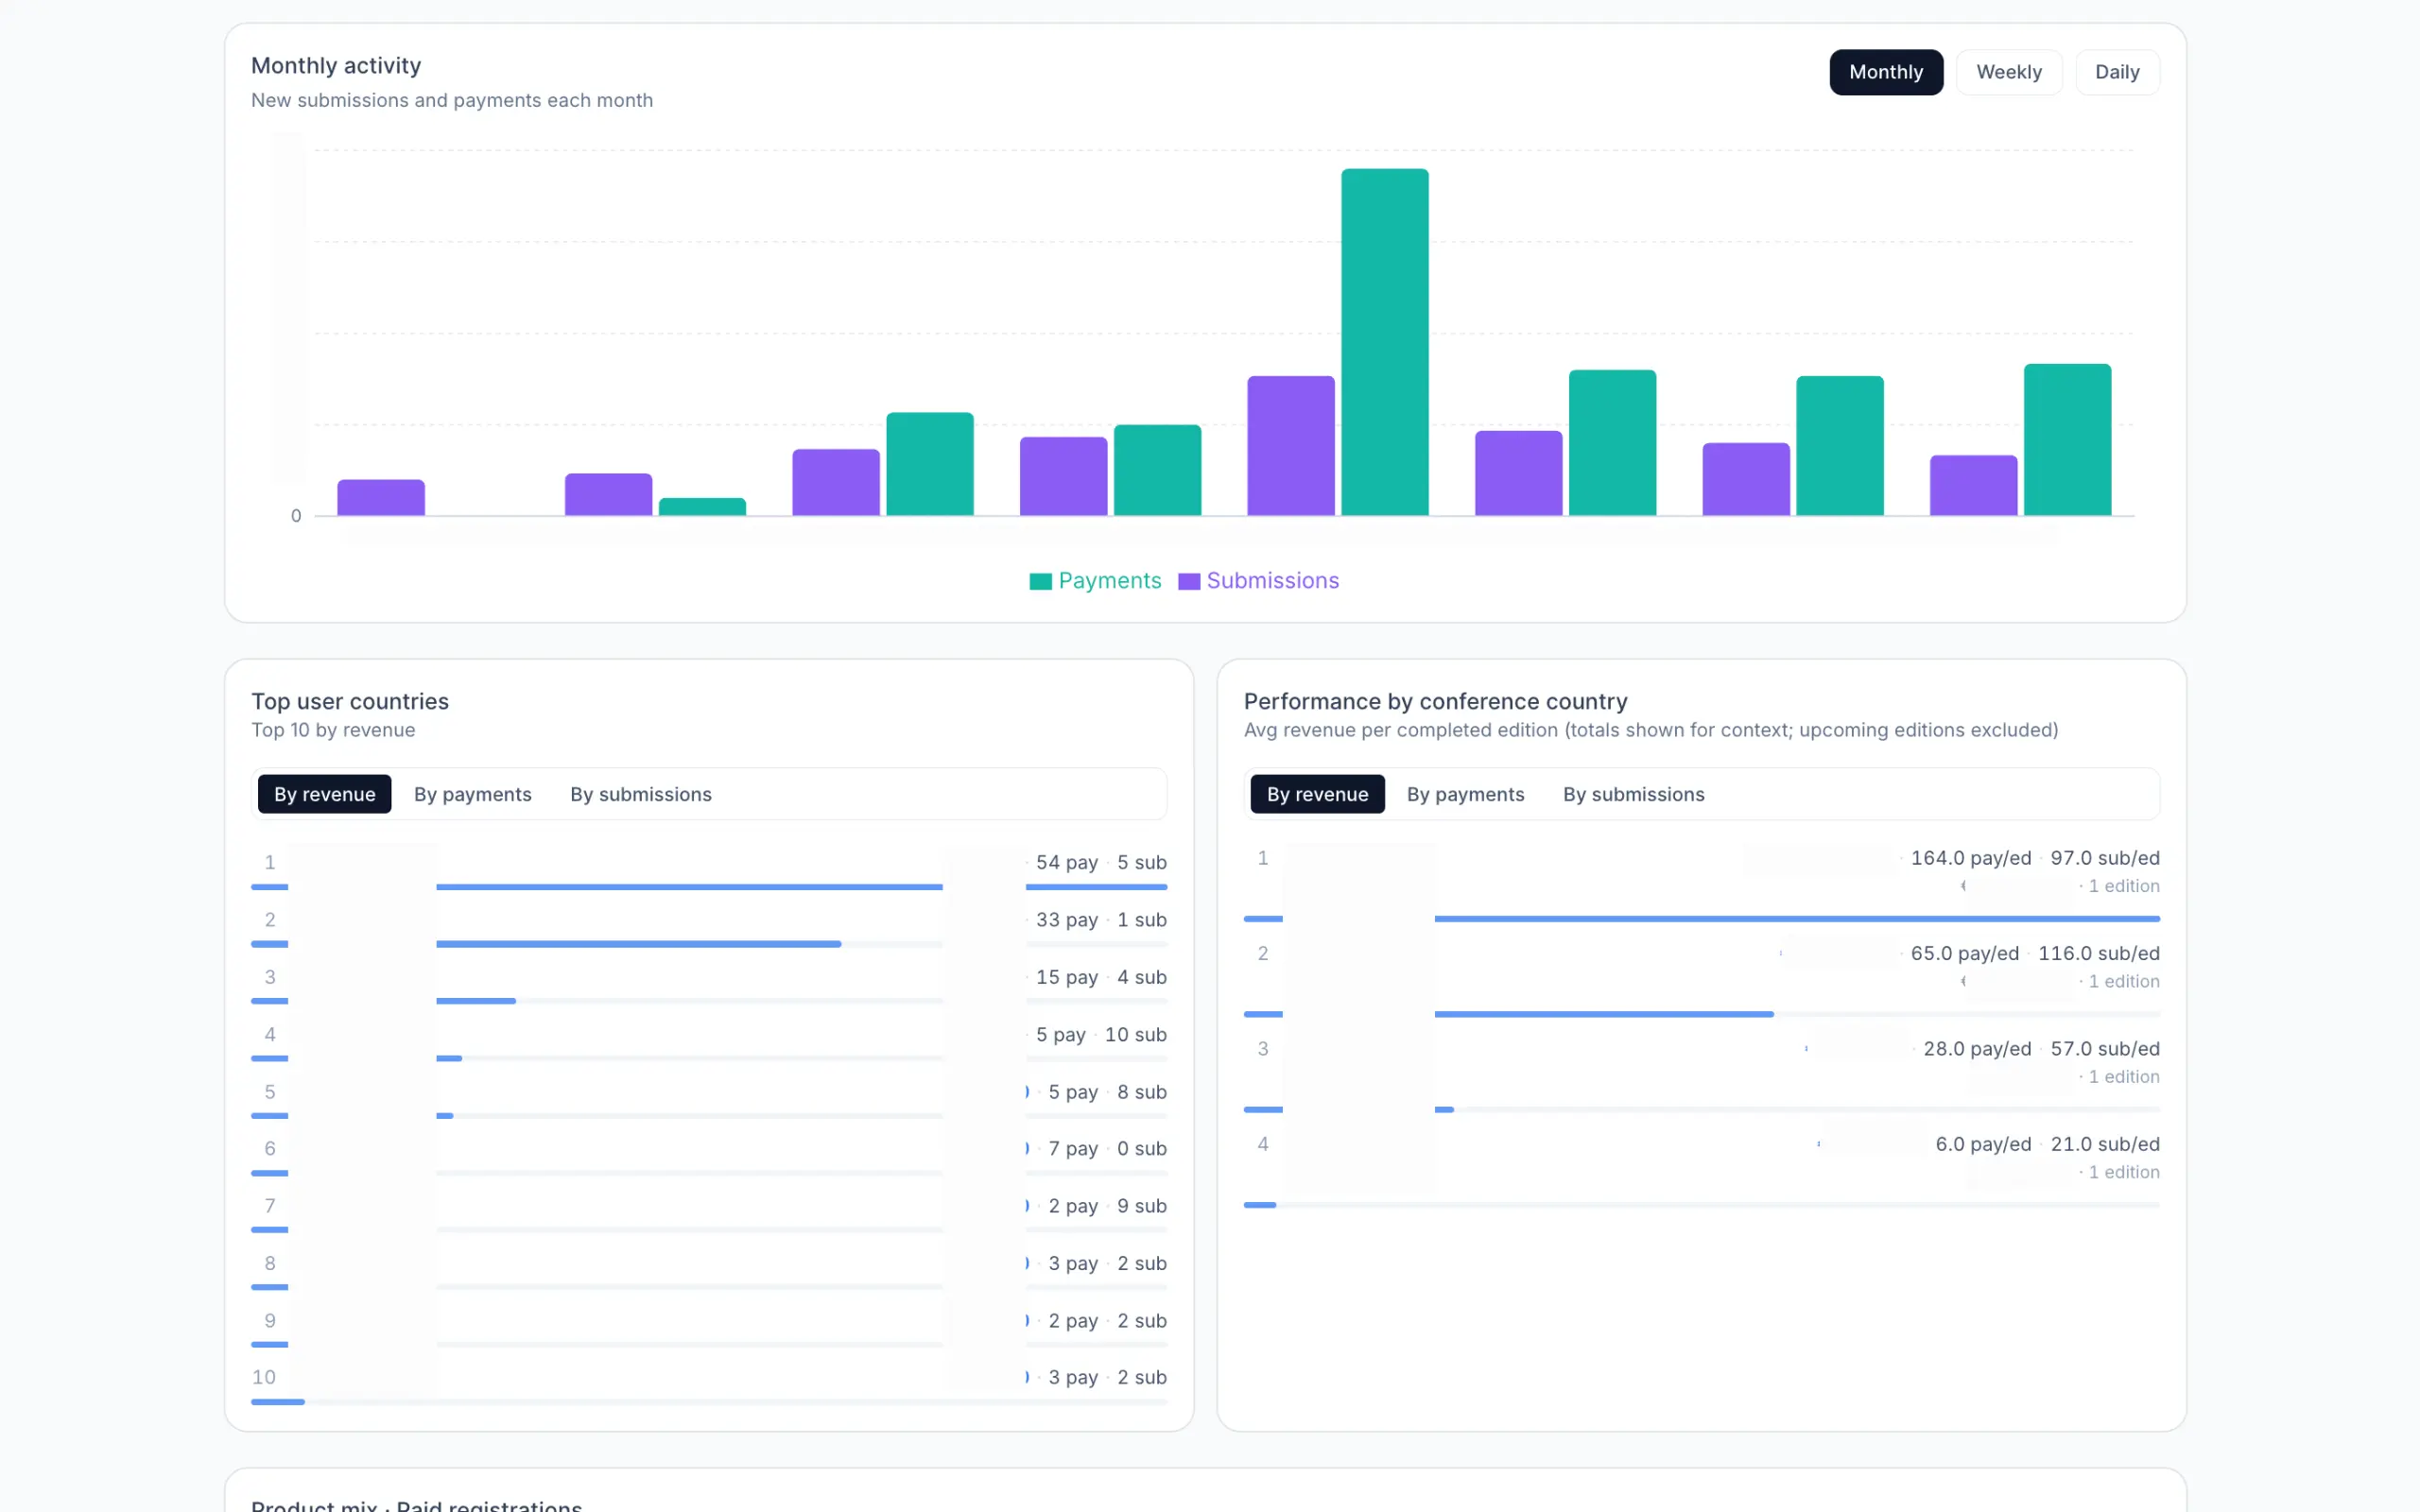
Headline KPIs, revenue trend, top markets, shareable filtered views.
Conference deep-dives
Every conference per round, with lifecycle curves showing how registrations fill before an event.
Geography
Revenue world map, country corridors (Sankey), and a mismatch table flagging clicks that do not have a matching payment.
Google Ads
Spend and performance with conversions kept in three separate buckets: what the platform reported, which payments the warehouse matched, and which records did not match. A match rate is not attribution certainty.
Lifecycle & cohorts
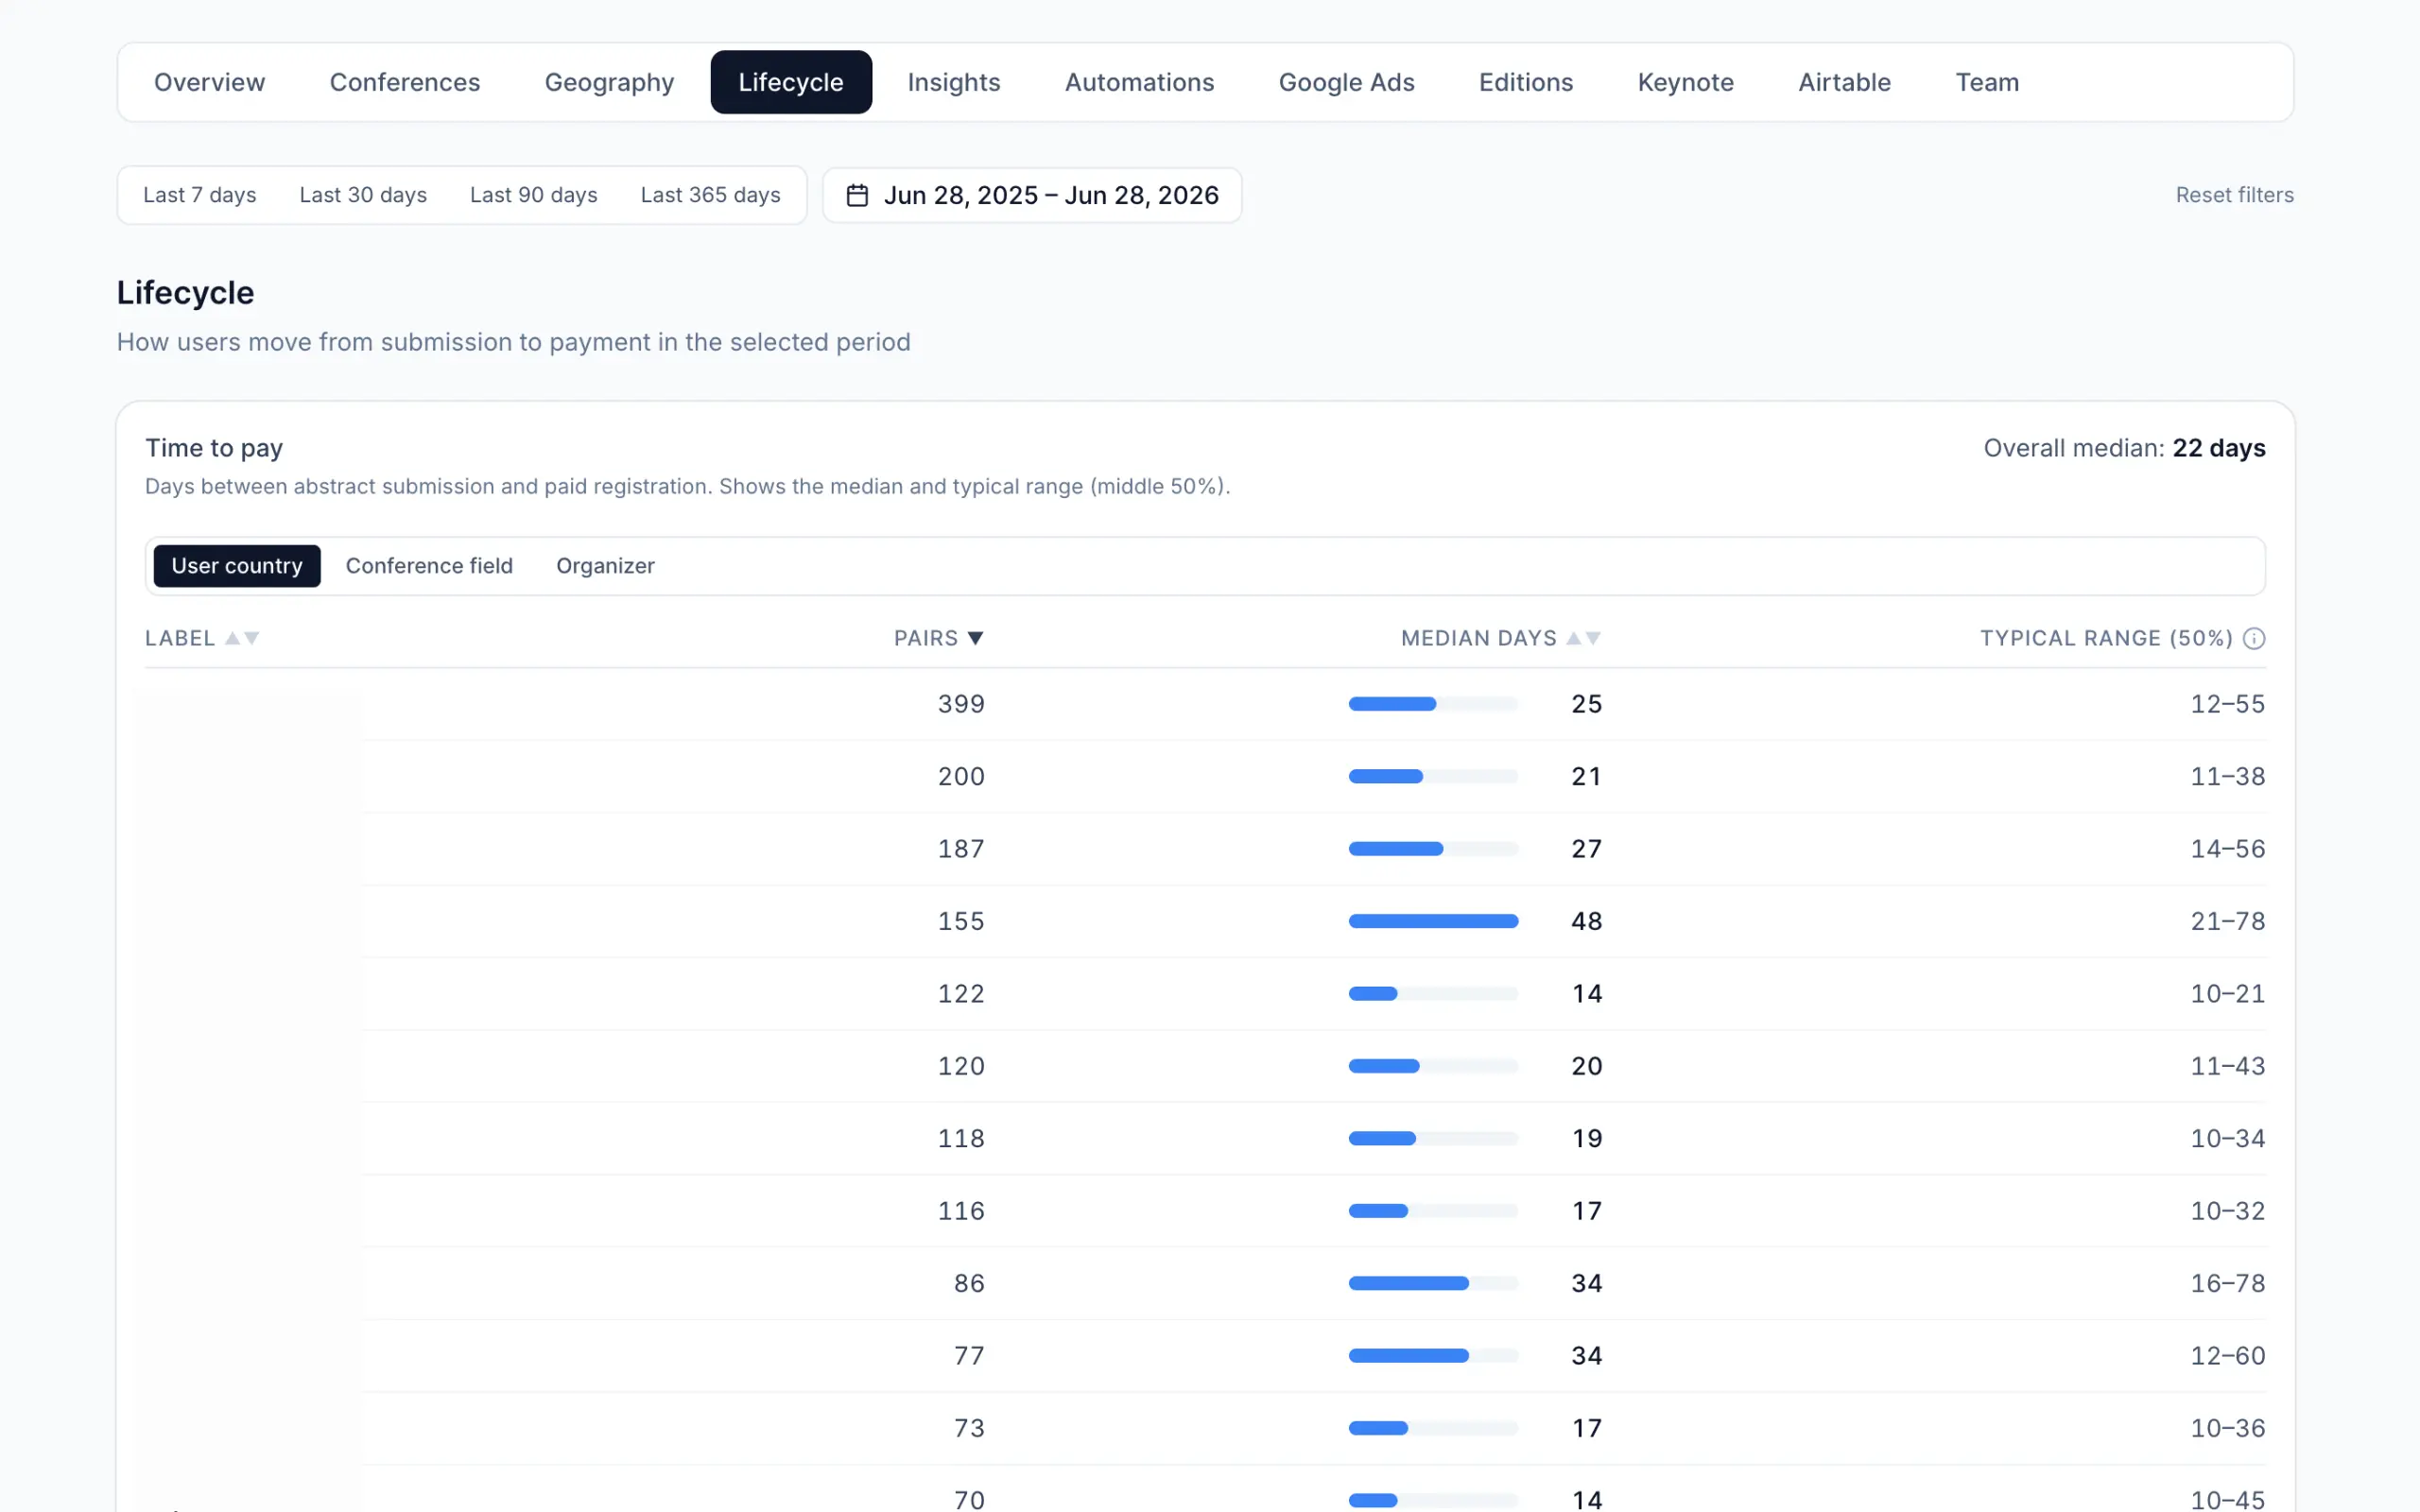
Time-to-pay, best months, round-over-round growth, repeat customers, acceptance funnel.
Automated alerts
A rule builder that watches the data and emails the team only when something genuinely changes.
30,000+conference submissions processed.
15,000+payment records reconciled.
500,000+website sessions across the portfolio.
100+GA4 properties, one per site.
~1.1Mrows across 12 Postgres tables.
90%+submission-to-payment match using fuzzy title matching plus email.
How to read these figures
Volumes are rounded ranges, not exact client counts. The table count, row estimate, match-rate method and daily refresh are our engineering figures. A match rate is not attribution certainty: platform-reported conversions, matched payments and unmatched records stay in separate buckets. Figures as of 10 September 2026.
PulseConf is a warehouse and dashboard Zyndix built to connect submissions, web analytics and advertising data — so the team can compare those sources in one place, with unmatched records still visible.
A data warehouse and reporting interface running on two lightweight servers, hardened and scheduled. Designed and built as in-house work at a Lithuanian conference organiser, documented here as a Zyndix project example.
Sitting on data you can't actually use?
Bring the report you currently prepare by hand. Start with a free 30-minute call.